Swing Trading and Value Investing Learning Plan
This article was a quick ChatGPT prompt to teach myself how to invest
Swing Trading and Value Investing Learning Plan
This is not financial advice, just my attempt to become more financially literate.
Phase 1: Foundation (Weeks 1-4)
Core Investment Principles
- Week 1: Market basics and terminology
- Asset classes, investment vehicles, derivatives and strategies
- Asset Classes: What you own
- Equities (stocks, REITs)
- Fixed Income (bonds, CDs, money market instruments)
- Cash and Cash Equivalents (savings accounts, money market accounts, Treasury bills)
- Commodities (gold, oil, agricultural products, etc.)
- Real Estate (though REITs bridge equities and real estate)
- Alternative Investments (hedge funds, private equity, etc.)
- Investment Vehicles: How it’s packaged ├── Individual securities ├── Mutual Funds ├── ETFs ├── Hedge Funds ├── Private Equity └── REITs
- Derivatives and Strategies: Tool that modify your exposure ├── Options ├── Futures ├── Short selling ├── Swaps └── Other derivatives>
- Asset Classes: What you own
- Key financial terms (P/E ratio, market cap, dividend yield, etc.)
- P/E: Price to Equity Ratio, Price of a share to Earning Per Share: It indicates whether a stock is over- or under-valued
- Earning Per share: A company net profit (net income - preferred dividends) / number of common outstanding shares: it’s the company’s profit per share.
- Martket Cap or Market Capitalization: It is the current price of the stock multiplied by the number of shares outstanding. It represents how much the market believes the company is worth and is fundamental in prodviding context for any financial analysis.
- Dividend Yield is the ratio of the dividends paid to the stakeholder for the year divided (last 4 quarters) divided by the price of the stock. It indicates how much continuous return is being sent back to the stakeholders. It’s a misleading indicator of company health and should never be used by itself. The dividend yield will go down when the stock is going down or if the firm is trying to seduce new investors irrespective of the health of the company. The value of the dividends also depends on the industry (REITs, master limited partnerships, and business development companies pay higher-than-average dividends) and the tax advantages: whether the dividends are qualifieds or ordinary.
- Float: Share available for public trading. outstanding shares minus restricted shares
- Restricted shares are company stock granted to employees that come with restrictions on when they can be sold or transferred.
- Different investment styles overview
- This will depend on the type of risks you are comfortable with and the types of asset classes you would like to hold.
- The investment style is decided by your risk profile, the market ap fo the companies you want to invest in, whether you want to invest in growth or value stock (what’s your time horizon), whether you value fixed income (money market, loans, bonds) or more variable incomes.
- Risk vs. return concepts
- Risk Capacity vs. Risk Tolerance
- Risk-adjusted returns
- Sharpe Ratio: Measure of risk-adjusted return. How much return does the stock provide over a risk-free return (typically a fixed-income asset) adjusted by the volatility of the investment. \(\frac{R_p - R_f}{\sigma_p}\) $R_p$: expected return of the portfolio/asset, $R_f$: Risk-free return, $\sigma_p$: standard deviation of the asset or portfolio.
- Market-order execution basics
- Asset classes, investment vehicles, derivatives and strategies
- Week 2: Financial statement analysis
- Income statement basics
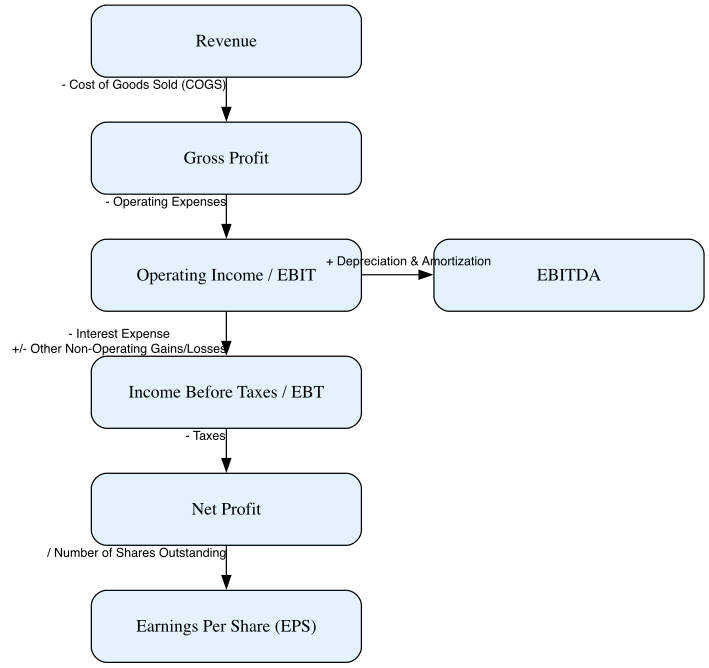
- Revenue: Total sales Generated by a company within a given time period.
- Gross Profit: It is the revenue minus the Cost of Good Solds (COGS), all direct costs associated to the production of the product the company sells. COGS can be direct cost of raw material and labor costs (CAPEX).
- Operating Income: The Earnings Before Interests and Taxes. It is the Gross Profit minus the operating expeneses (e.g. workforce, legal, physical capital costs). The operating expenses is the day to day cost of running a business.
- Income before Taxes: It is obtained after subtracting non-operating expenses from the operating income. Non-operating expenses are non-recurring expenses such as interest expenses, one-time legal fees, inventory write-offs, as well as non-operating gains or losses.
- Net Profit: is the Net income after taking into account taxes.
- Earnings per share (EPS): The Net Income divided by the number of shares outstanding defined above.
- EBITDA: Earnings Before Interest Depreciation and Amortization is the operating income plus the depreciation and amortization. It is used to compare profitability without the distortions of different tax rules, amortization and depreciation accounting decisions.
- Horizontal vs. Vertical Analysis
- Vertical analysis expresses each item in a financial statement as a percentage of a base figure within that same statement. The goal is to understand the relative importancde of each item to a company’s performance.
- Horizontal analysis compares financial statement items across two or more periods to identify changes over time. It helps spot trends in revenue, cost and profitability.
- Balance sheet fundamentals
- The Balance sheet informs on the net worth of a company at a given time.
- Fundamental Accounting Equation: “Assets:= Liabilities + Equity”
- Assets: Everything the company owns including the building(s) itself
- Current assets (cash, account receivable, short-term securities, inventory) and non-current assets (property and equipment, long-term marketable securities, intengible assets). Current assets are liquid and have a clear retail value.
- Liabilities “What’s owed.” The liabilities consist of all the present obligations of a company and are separated between current (accounts payable, salaries and wage payable, deferred revenues, short-term debt…) and non-current (deferred revenue, long-term debt, long-term lease obligations). Those values are fixed and are paid first in teh event of a bankruptcy.
- Equity “The owners’ shares”. It is whatever assets are left after the liabilities are paid. Those assets return to the owners. Unlike liabilities, the equity is highly variable depending on the changes in the value of the assets (depreciation, ). Common line items are common stock, preferred stock, treasury stock and retained earnings.
- Cash flow statement importance
- What happens to a company’s cash during an accounting period.
- Operating activities: The money coming in and out from standard operations (selling a good, paying an employee)
- Investing activities: The money that flows from buying or selling physical assets with cash.
- Financing activities: The money that flows from equity or debt and their revenue/payments.
- Direct method: all cash collections minus all cash disbursements.
- Indirect method: Starts from the net income in the income statement and make adjustments for revenues and expenses (accruals) as well as non-cash expenses for the period (amortization and depreciation…).
- Key financial ratios and metrics
- Income statement basics
- Week 3: Advanced Financial Metrics
- Return on Equity (ROE):
- Net Income divided by Shareholders Equity. It indicates how well the company uses shareholders investment to generate profit
- Debt-to-equity ratios: -This is a solvency ratio indicating the proportion of liabilities to the toal market equity
- \[\text{Debt/Equity} = \frac{\text{Total Liabilities}}{\text{Total Shareholder's Equity}}\]
- Return on assets (ROA): It’s the next income divided by the total value of assets. How efficient are we in converting assets into profit.
- Price-to-book (P/B) ratios
- Profit margins and efficiency ratios
- Net Profit Margin
- $$ \frac{\text{Net Profit}}{\text{Revenue}}
- Cash flow metrics
- How to use these ratios together for company analysis
- Return on Equity (ROE):
- Week 4: Investment Styles Deep Dive
- Growth vs. Value investing characteristics
- Income investing strategies
- Index investing philosophy
- Risk tolerance and style matching
- Building a personal investment philosophy
Recommended Resources
- Books: “The Intelligent Investor” by Benjamin Graham (Chapters 1-3)
- Online: Investopedia’s basic investing course
- Practice: Open a paper trading account (TD Ameritrade’s thinkorswim or similar)
Phase 2: Value Investing Deep Dive (Weeks 5-10)
Core Value Investing Concepts
- Week 5: Warren Buffett’s philosophy
- Business moats and competitive advantages
- Quality companies vs. cheap stocks
- Long-term thinking approach
- Week 6: Fundamental analysis techniques
- Intrinsic value calculation methods
- Discounted cash flow (DCF) modeling
- Price-to-book and price-to-earnings analysis
- Week 7: Company research methodology
- Annual reports (10-K) and quarterly reports (10-Q)
- Industry analysis and comparison
- Management quality assessment
- Week 8: Value screening and selection
- Stock screeners and filters
- Red flags to avoid
- Portfolio construction for value investing
- Week 9: Case studies and practice
- Analyze 3-5 potential value investments
- Build simple valuation models
- Document investment thesis for each
- Week 10: Value investing review and testing
- Review all concepts learned
- Take practice quizzes
- Refine investment criteria
Recommended Resources
- Books:
- “Security Analysis” by Graham & Dodd
- “The Little Book of Value Investing” by Christopher Browne
- Tools: Morningstar, Yahoo Finance, SEC EDGAR database
- Practice: Research and analyze 10 companies using value metrics
Phase 3: Swing Trading Fundamentals (Weeks 11-16)
Technical Analysis Foundation
- Week 11: Chart patterns and trends
- Support and resistance levels
- Trendlines and channels
- Common chart patterns (head & shoulders, triangles, flags)
- Week 12: Technical indicators
- Moving averages (SMA, EMA)
- RSI, MACD, Stochastic oscillators
- Volume analysis and interpretation
- Week 13: Swing trading strategies
- Breakout trading
- Pullback and retracement strategies
- Momentum and mean reversion approaches
- Week 14: Risk management for swing trading
- Position sizing calculations
- Stop-loss and take-profit strategies
- Risk-reward ratios (minimum 1:2 or 1:3)
- Week 15: Market timing and entry/exit
- Market cycle awareness
- Sector rotation concepts
- Economic indicators impact on swing trades
- Week 16: Swing trading psychology
- Emotional discipline
- Trading journal importance
- Common psychological pitfalls
Recommended Resources
- Books:
- “Technical Analysis of the Financial Markets” by John Murphy
- “Swing Trading for Dummies” by Omar Bassal
- Software: TradingView, TC2000, or similar charting platforms
- Practice: Execute 20+ paper swing trades over 4 weeks
Phase 4: Integration and Advanced Concepts (Weeks 17-20)
Combining Both Approaches
- Week 17: Hybrid strategies
- Using technical analysis to time value investments
- Finding undervalued stocks with strong technical setups
- Portfolio allocation between swing and value positions
- Week 18: Market environment adaptation
- Bull market vs. bear market strategies
- Economic cycle considerations
- Sector-specific approaches
- Week 19: Advanced risk management
- Portfolio diversification principles
- Correlation analysis
- Options strategies for hedging (basic covered calls/puts)
- Week 20: Performance tracking and improvement
- Setting up tracking systems
- Regular portfolio review processes
- Continuous learning plan
Phase 5: Real-World Application (Weeks 21-24)
Live Trading Preparation
- Week 21: Final strategy refinement
- Document complete trading/investing rules
- Set up real brokerage account
- Plan initial capital allocation
- Week 22: Start small-scale live trading
- Begin with small position sizes
- Focus on process over profits
- Maintain detailed trading journal
- Week 23: Performance analysis
- Review first month of live results
- Identify areas for improvement
- Adjust strategies based on real experience
- Week 24: Long-term plan development
- Set 1-year and 5-year goals
- Create ongoing education schedule
- Establish regular review periods
Daily/Weekly Activities Throughout
Daily (30-45 minutes)
- Market news and economic calendar review
- Monitor existing positions
- Update trading/investment journal
- Chart review for swing trading opportunities
Weekly (2-3 hours)
- Deep research on 1-2 potential investments
- Portfolio performance review
- Educational reading (books/articles)
- Practice technical or fundamental analysis
Monthly
- Complete portfolio review and rebalancing
- Strategy performance assessment
- Adjust rules based on experience
- Set goals for following month
Key Tools and Resources
Essential Software/Platforms
- Brokerage: Fidelity, Charles Schwab, or Interactive Brokers
- Analysis: Morningstar Premium, FactSet (if available)
- Charting: TradingView Pro or TC2000
- Screening: Finviz, StockRover, or similar
Recommended Books (Priority Order)
- “The Intelligent Investor” - Benjamin Graham
- “A Random Walk Down Wall Street” - Burton Malkiel
- “Technical Analysis of the Financial Markets” - John Murphy
- “The Little Book That Still Beats the Market” - Joel Greenblatt
- “Reminiscences of a Stock Operator” - Edwin Lefèvre
Key Metrics to Master
Value Investing
- Price-to-Earnings (P/E) ratio
- Price-to-Book (P/B) ratio
- Debt-to-Equity ratio
- Return on Equity (ROE)
- Free Cash Flow yield
- Dividend yield and payout ratio
Swing Trading
- Relative Strength Index (RSI)
- Moving Average Convergence Divergence (MACD)
- Bollinger Bands
- Volume indicators
- Risk-reward ratios
- Win rate and average win/loss
Success Milestones
Month 1
- Understand basic financial statements
- Complete 10 company fundamental analyses
- Set up paper trading account
Month 2
- Complete first DCF valuation model
- Identify 5 potential value investments
- Learn basic chart reading
Month 3
- Execute 10+ successful paper swing trades
- Develop personal screening criteria
- Create investment thesis template
Month 6
- Begin live trading with small amounts
- Achieve consistent paper trading results
- Complete advanced risk management training
Common Pitfalls to Avoid
- Overcomplicating strategies - Keep it simple initially
- Ignoring risk management - Never risk more than 2% per trade
- Emotional trading - Stick to your rules regardless of emotions
- Insufficient research - Never invest without proper analysis
- Overtrading - Quality over quantity in both approaches
- Following tips blindly - Always do your own research
- Unrealistic expectations - Both approaches require patience and discipline
Remember: The goal is to develop two complementary skill sets that can work together in different market environments. Value investing provides the foundation for long-term wealth building, while swing trading can generate additional income and improve market timing skills.
This post is licensed under CC BY 4.0 by the author.